HPLC AND PEPTIDE PURITY EXPLAINED
RESEARCH LIBRARY • ANALYTICAL TESTING & QUALITY
Understanding How Peptide Purity Is Measured
Peptide purity is one of the most frequently discussed measurements in peptide research. Laboratory reports often display results such as 98.5%, 99.2%, or 99.7% purity, but what do those percentages actually mean?
One of the most widely used analytical techniques for evaluating peptide purity is High Performance Liquid Chromatography (HPLC).
HPLC allows researchers to separate and measure detectable components within a sample, helping determine how much of the chromatographic signal is associated with the target peptide versus other detectable substances.
However, a high purity percentage does not tell the entire story.
Understanding HPLC, chromatograms, purity calculations, and analytical limitations is essential for interpreting peptide Certificates of Analysis (COAs) responsibly.
WHAT IS HPLC?
HIGH PERFORMANCE LIQUID CHROMATOGRAPHY
HPLC is an analytical technique used to separate components within a liquid sample.
In peptide analysis, it is commonly used to evaluate:
Peptide purity
Related peptide impurities
Degradation products
Sample composition
Stability-related changes
HOW DOES IT WORK?
A prepared sample is introduced into an HPLC system.
The sample travels through a specialized column containing a stationary phase.
Different components interact differently with the column and the moving liquid, called the mobile phase.
Because of these differences, components travel through the system at different rates.
As they leave the column, a detector records their signals.
The result is a graphical representation called a chromatogram.
THE CENTRAL PRINCIPLE
HPLC separates detectable components so researchers can evaluate their relative analytical signals.
It is a powerful method for assessing chemical purity, but it does not independently establish every aspect of product quality.
HOW HPLC WORKS
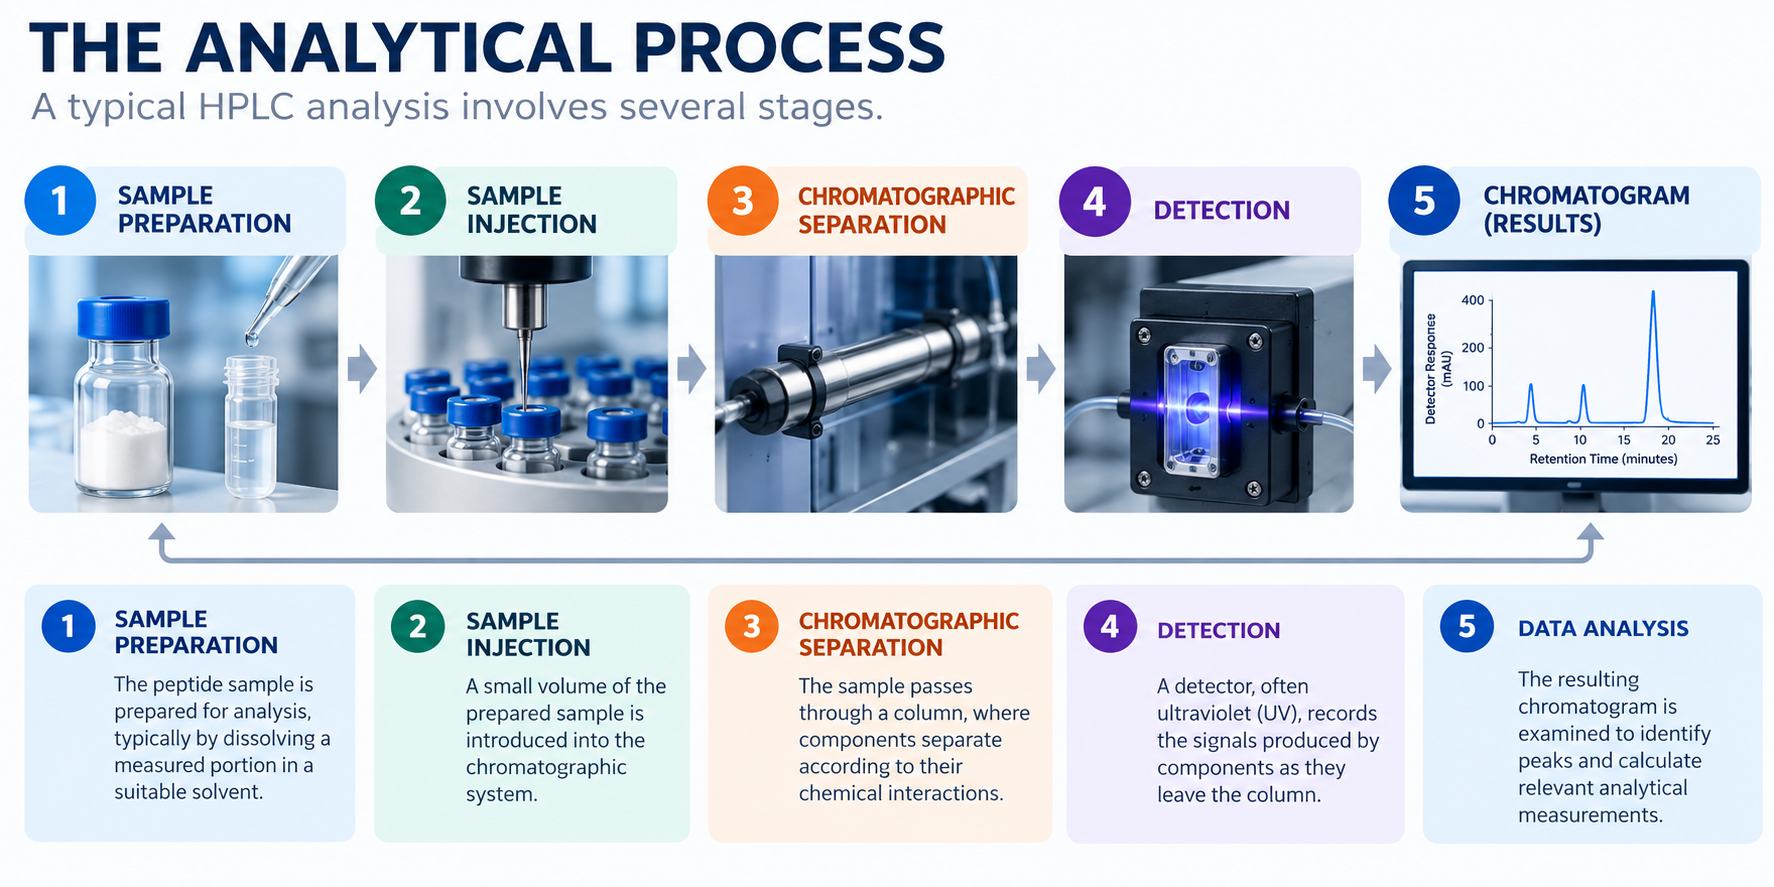
THE ANALYTICAL PROCESS
1. SAMPLE PREPARATION
The peptide sample is prepared for analysis, typically by dissolving a measured portion in a suitable solvent.
2. SAMPLE INJECTION
A small volume is introduced into the chromatographic system.
3. CHROMATOGRAPHIC SEPARATION
The sample passes through a column, where components separate according to their chemical interactions.
4. DETECTION
A detector, often ultraviolet (UV), records the signals produced by components as they leave the column.
5. DATA ANALYSIS
The resulting chromatogram is examined to identify peaks and calculate relevant analytical measurements.
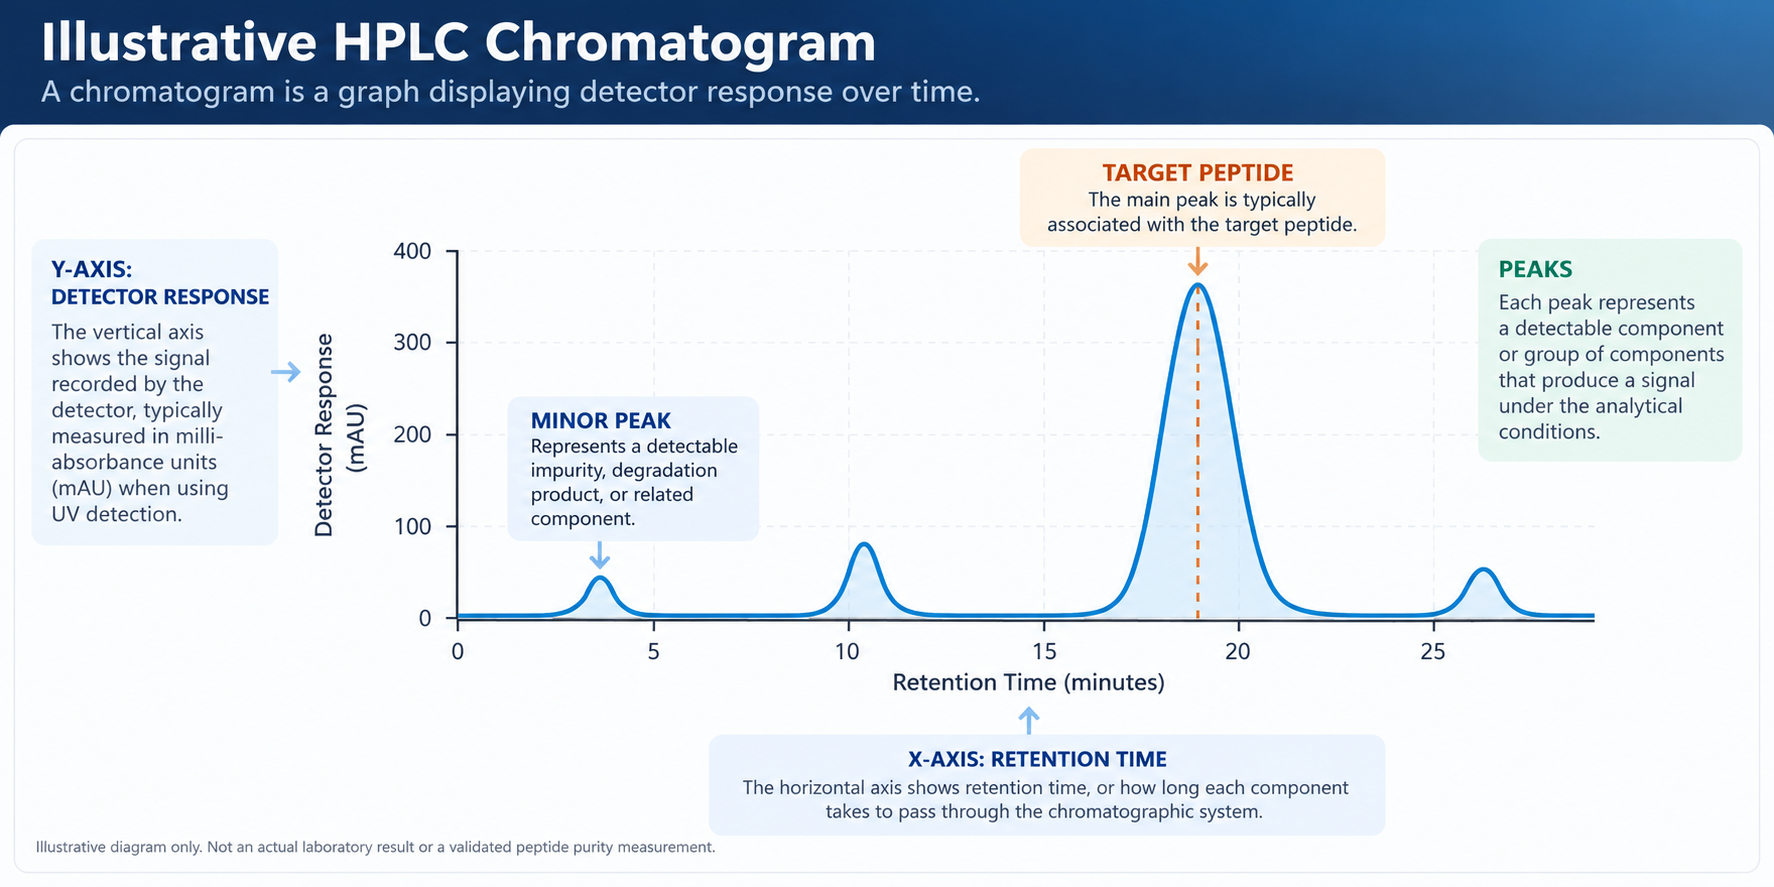
UNDERSTANDING A CHROMATOGRAM
WHAT ARE THOSE PEAKS?
A chromatogram is a graph displaying detector response over time.
RETENTION TIME
The horizontal axis generally represents retention time, or how long a component takes to pass through the chromatographic system.
DETECTOR RESPONSE
The vertical axis represents the signal recorded by the detector.
PEAKS
Each resolved peak represents a detectable component or group of components producing a signal under the analytical conditions.
MAIN PEAK
The largest peak is often associated with the target peptide.
MINOR PEAKS
Smaller peaks may represent related impurities, degradation products, or other detectable components.
However, peak size alone does not prove chemical identity, and two different compounds may sometimes overlap within the same peak.
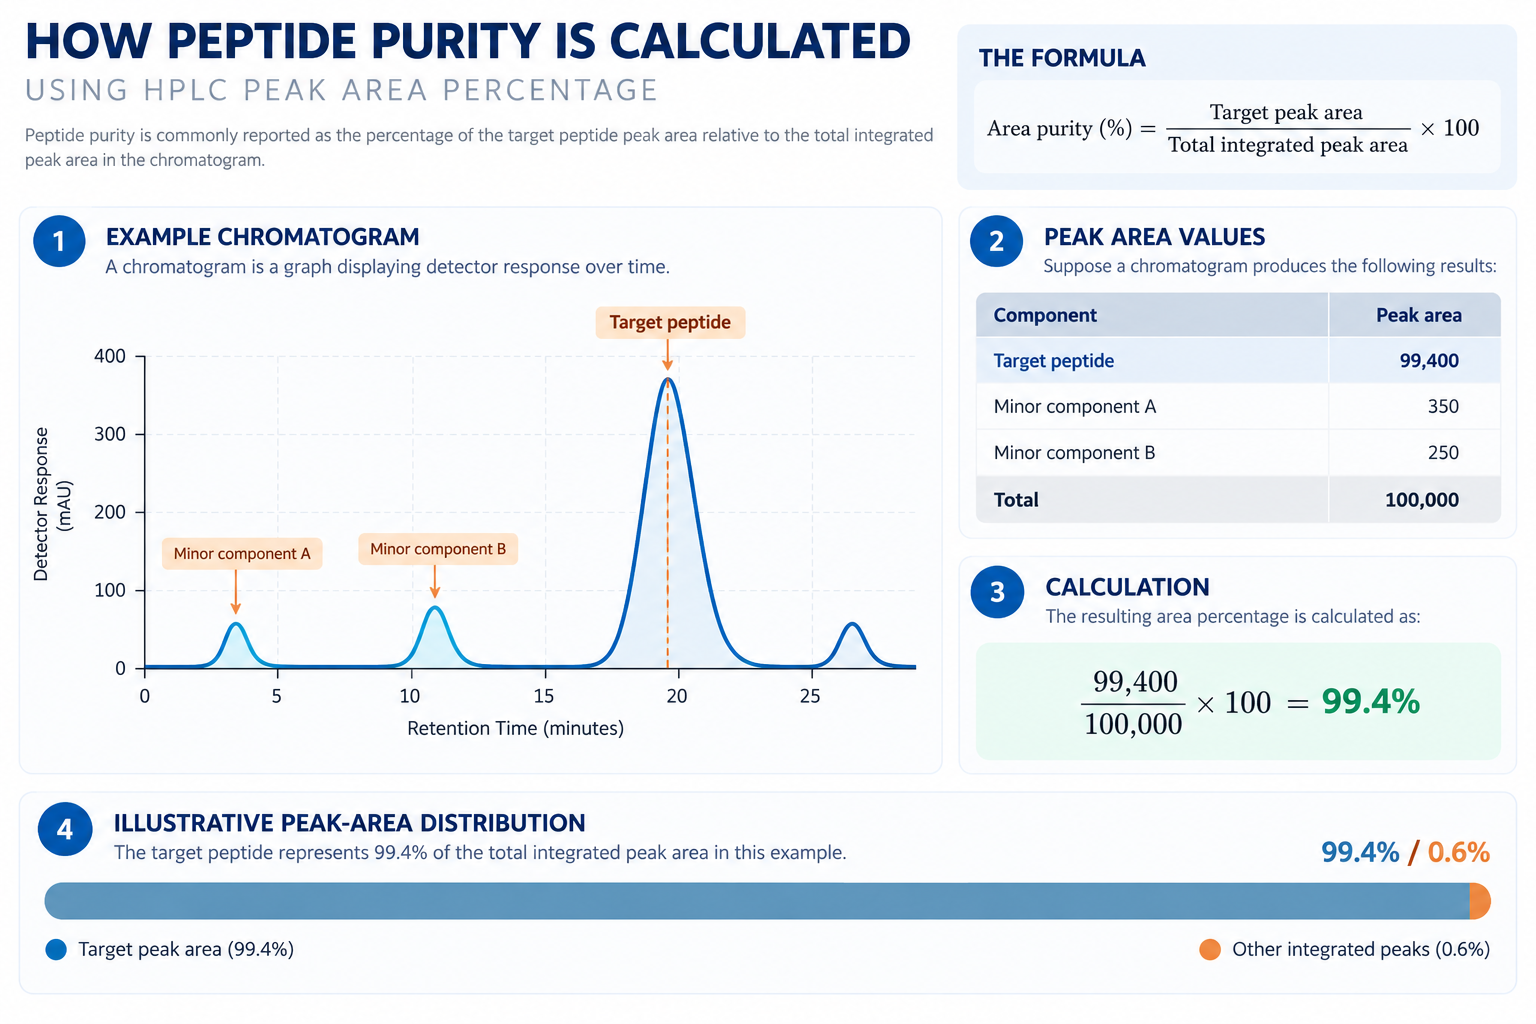
HOW PEPTIDE PURITY IS CALCULATED
UNDERSTANDING PEAK AREA
A common way to report chromatographic purity is through peak-area normalization.
The laboratory measures the area associated with the target peptide peak and compares it with the total area of relevant integrated peaks.
IMPORTANT LIMITATION
This is a simplified illustration of chromatographic area purity.
It assumes the integrated peaks are appropriately included and that the calculation uses their measured detector responses.
Different compounds can produce different detector responses at the same mass concentration.
Therefore, 99.4% chromatographic area purity does not necessarily mean 99.4% of the sample's total physical mass consists of the target peptide.
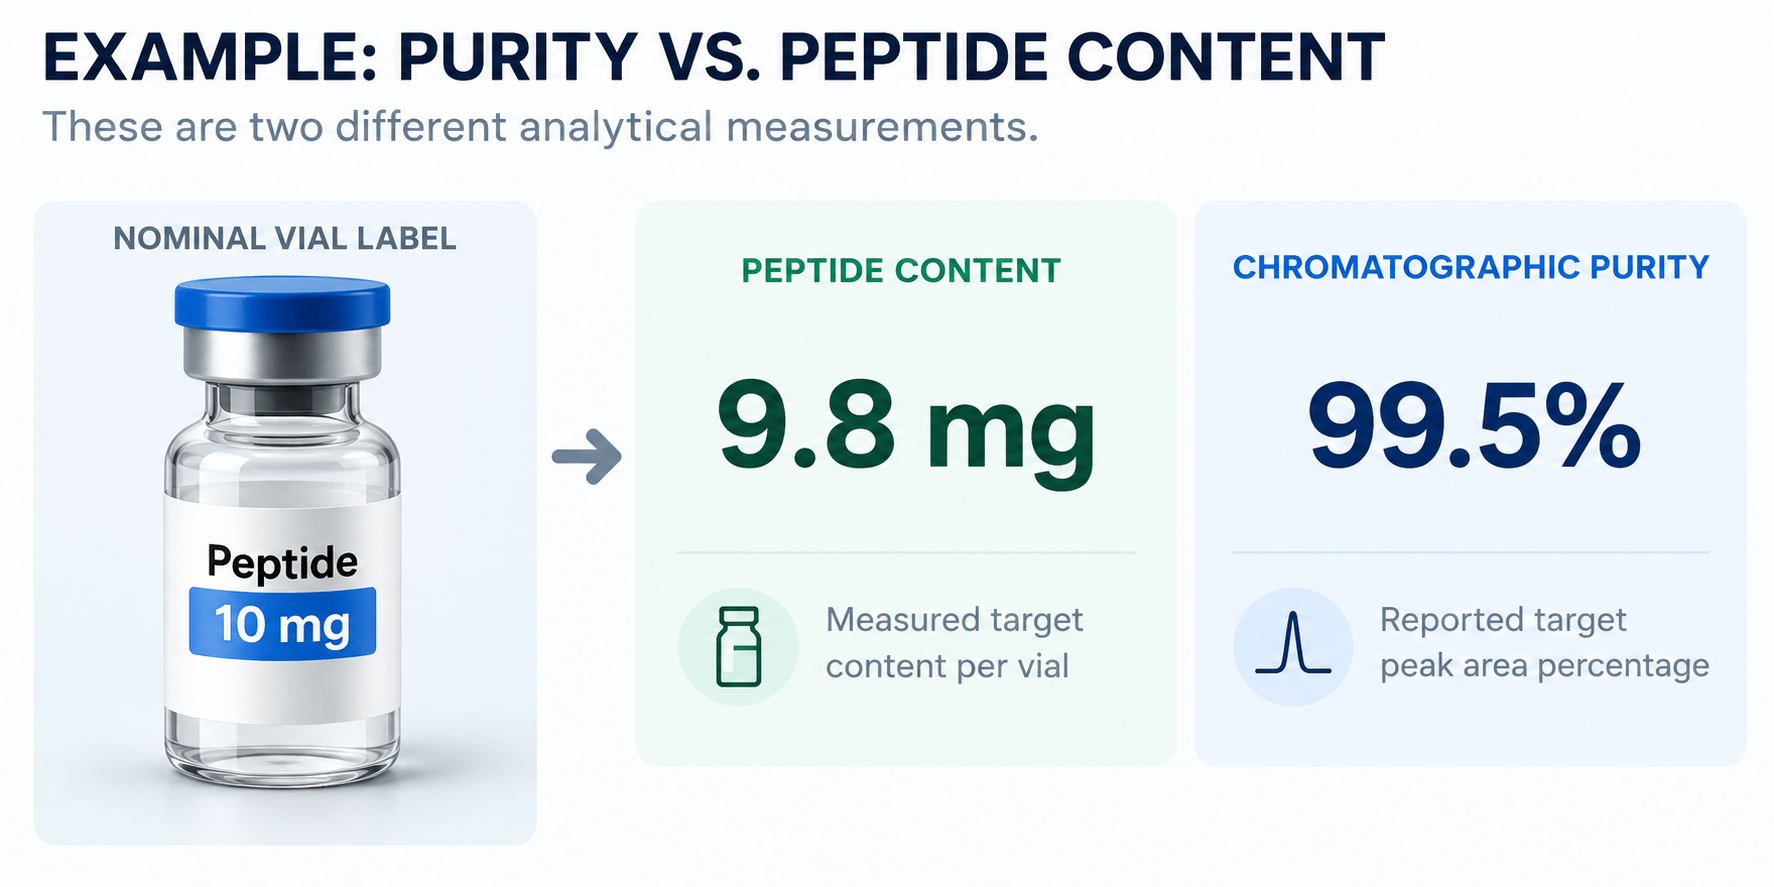
PURITY IS NOT THE SAME AS PEPTIDE CONTENT
TWO DIFFERENT ANALYTICAL MEASUREMENTS
One of the most common mistakes in reading peptide COAs is confusing purity with the amount of peptide in a vial.
PURITY
Describes the relative analytical contribution of the target peptide under the specified assay conditions.
PEPTIDE CONTENT
Describes the measured amount of target peptide, often reported in milligrams per vial.
EXAMPLE
REMEMBER
Purity asks how clean the analytical profile is. Content asks how much target peptide was measured.
WHAT CAN LOWER PEPTIDE PURITY?
UNDERSTANDING PEPTIDE IMPURITIES
Peptides can contain impurities originating from manufacturing, purification, storage, or chemical degradation.
Common categories include:
INCOMPLETE PEPTIDE SEQUENCES
During peptide synthesis, an amino acid may fail to attach correctly, potentially producing a shorter peptide sequence.
DELETION OR INSERTION IMPURITIES
A peptide may contain a missing or unintended amino acid.
OXIDATION
Certain amino acid residues are susceptible to oxidation, potentially changing the peptide's chemical properties.
DEAMIDATION
Some peptides can undergo chemical changes involving particular amino acid side chains.
HYDROLYSIS
Chemical bonds may break under certain conditions, producing degradation products.
RELATED SYNTHESIS BYPRODUCTS
Manufacturing may generate structurally related compounds that require separation or further purification.
IMPORTANT DISTINCTION
Not all impurities are equally harmful, and an HPLC purity percentage alone does not establish their identities, concentrations by mass, or biological significance.
Identifying impurities may require additional analytical techniques.
HPLC VS. LC-MS
WHY BOTH CAN MATTER
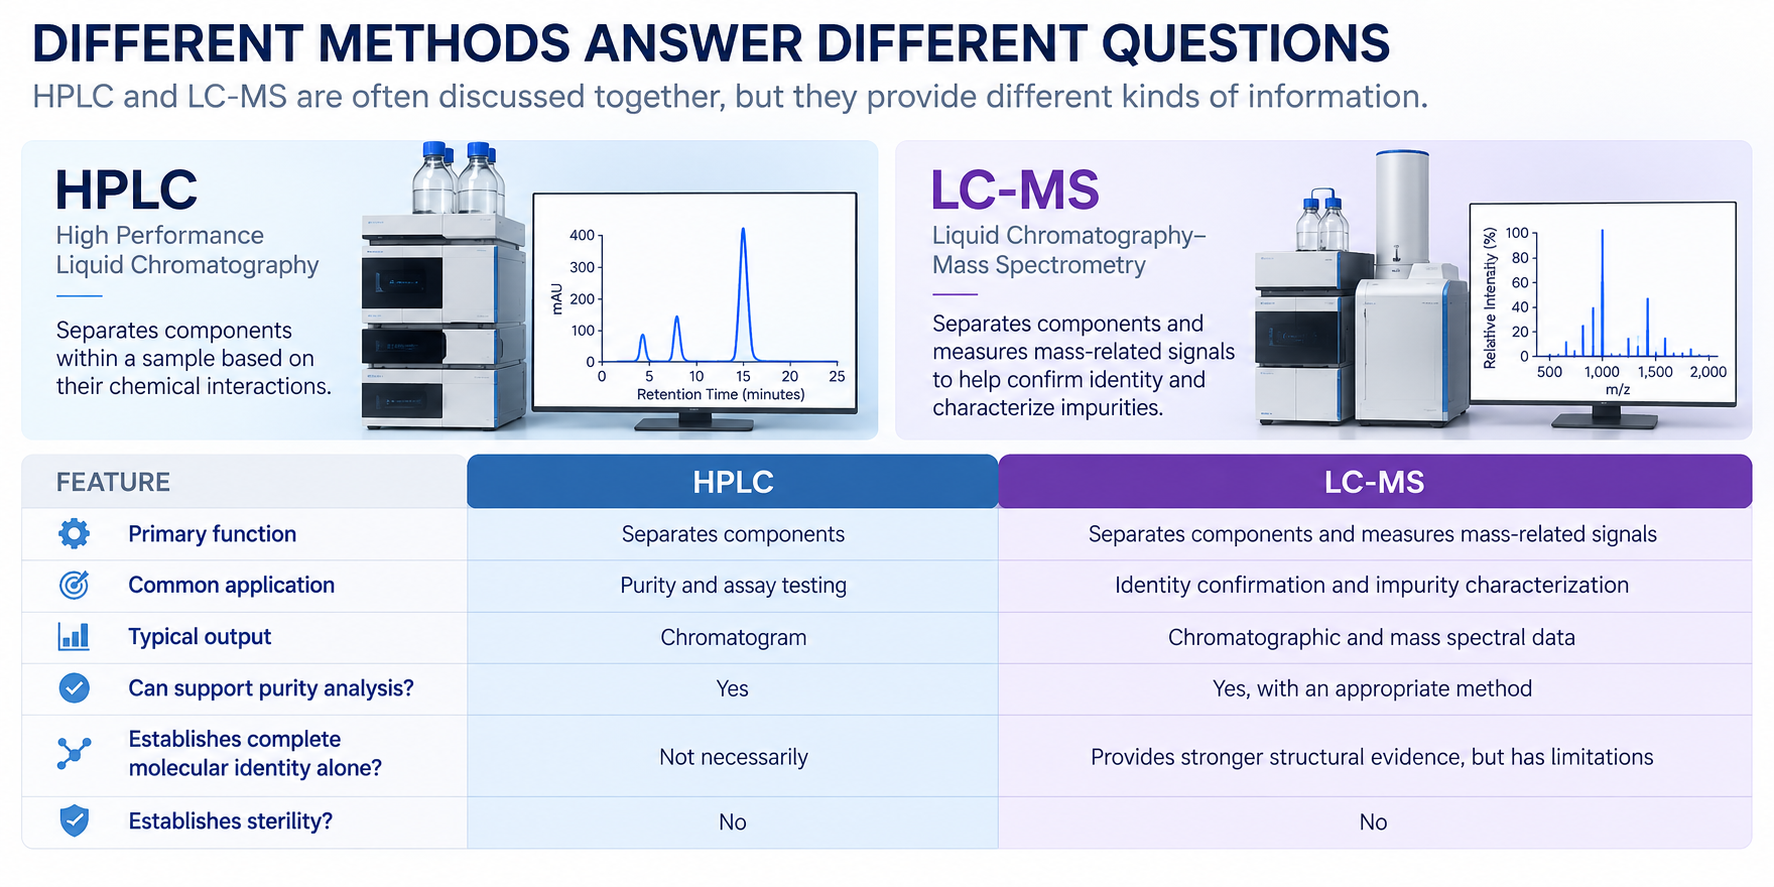
HPLC can help demonstrate that a sample has a dominant chromatographic component.
Mass spectrometry can provide additional evidence about the molecular mass of that component.
Together, appropriately developed methods can provide stronger analytical characterization than a single nonspecific measurement.
FDA guidance recognizes the value of complementary analytical procedures and notes that chromatographic retention time alone is generally insufficient for specific identification.
WHY METHOD VALIDATION MATTERS
NOT ALL HPLC TESTS ARE EQUIVALENT
Two laboratories may analyze the same material using different columns, solvents, detectors, integration settings, and analytical procedures.
Their reported results may not be directly comparable.
Important method-performance characteristics include:
Specificity and selectivity Can the method distinguish the target peptide from interfering substances?
Accuracy How closely do quantitative results agree with accepted reference values?
Precision How reproducible are the measurements?
Linearity and range Does the method provide an appropriate quantitative response over the intended range?
Detection limit What is the smallest amount that can be reliably detected under defined conditions?
Quantitation limit What is the smallest amount that can be measured with suitable performance?
Robustness How reliably does the procedure perform when small, deliberate method variations occur?
These concepts are addressed in the FDA and ICH Q2(R2) analytical validation framework.
WHY THIS MATTERS
A purity number is more meaningful when supported by an analytical method demonstrated to be suitable for its intended purpose.
A report displaying 99.9% purity is not automatically more trustworthy than one reporting 99.2% if the underlying methods, sample identities, or analytical limitations differ.
DOES HIGHER PURITY MEAN A BETTER PRODUCT?
PURITY IS IMPORTANT, BUT IT IS NOT EVERYTHING
A high reported purity percentage can be a favorable analytical finding.
However, product quality cannot be reduced to a single percentage.
Other considerations include:
Correct identity
Measured peptide content
Relevant impurities
Residual solvents
Water content
Stability
Endotoxin levels
Sterility, when applicable
Manufacturing consistency
Sample and lot traceability
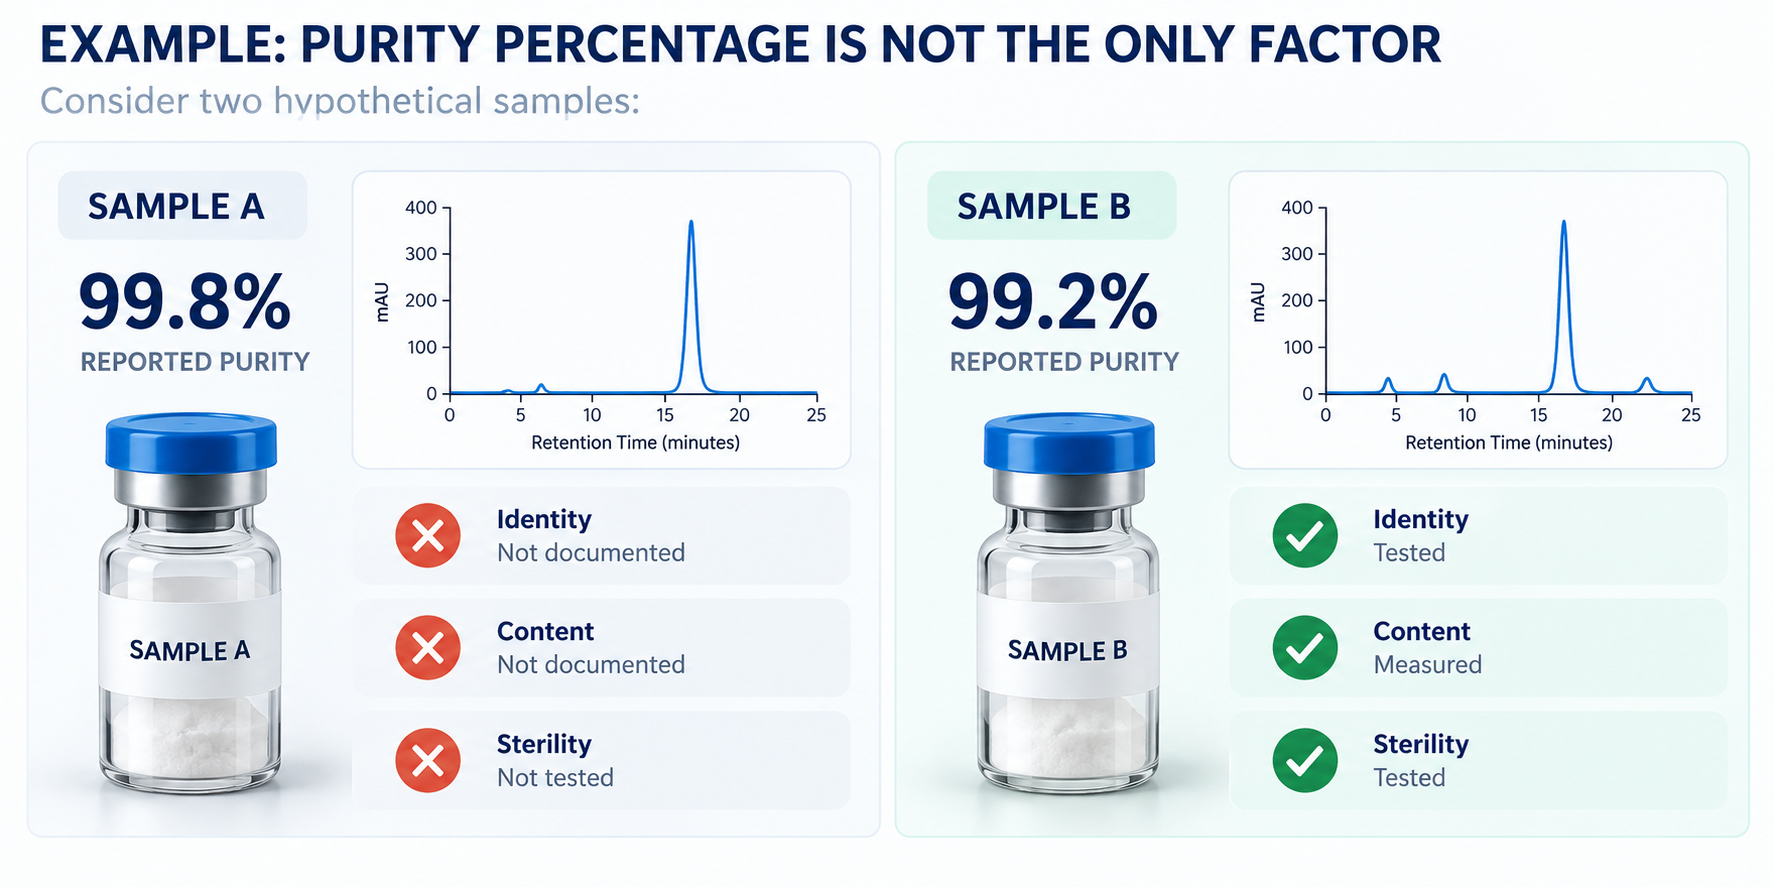
AN EXAMPLE
Sample A has the higher reported purity percentage.
Sample B has more types of analytical information available.
That does not automatically establish that Sample B is superior, but it demonstrates why a purity percentage alone is an incomplete basis for evaluating quality.
DOES 99% PURITY MEAN 99% SAFE?
NO. PURITY AND SAFETY ARE DIFFERENT QUESTIONS.
A high-purity peptide is not necessarily safe for human administration.
HPLC purity testing does not establish:
Clinical safety
Effective dosing
Appropriate administration
Long-term toxicity
Drug interactions
Endotoxin levels
Sterility
FDA approval
THE DIFFERENCE
Analytical purity describes a property of the tested sample.
Clinical safety concerns what happens when a compound is used in humans.
Determining clinical safety requires a substantially broader evidence base.
99% purity is not a 99% safety rating.
WHAT HPLC MAY MISS
UNDERSTANDING ANALYTICAL LIMITATIONS
HPLC can be extremely useful, but every analytical method has limitations.
Depending on the method, HPLC purity testing may fail to fully characterize:
CO-ELUTING COMPOUNDS
Two or more substances may emerge from the column together, appearing as one unresolved peak.
NON-DETECTED MATERIALS
Some substances may produce little or no signal with the selected detector.
VERY LOW-LEVEL IMPURITIES
Components below the method's detection or reporting limits may not appear in the reported results.
RESIDUAL SOLVENTS
A peptide purity assay is not necessarily designed to measure residual manufacturing solvents.
WATER AND COUNTERIONS
Water, salts, and counterions may not be adequately represented by the chromatographic area percentage.
MICROBIAL CONTAMINATION
A standard peptide purity chromatogram is not a sterility test.
BACTERIAL ENDOTOXINS
Endotoxin testing requires an appropriate separate analytical procedure.
THE TAKEAWAY
HPLC provides information within the scope of the method used.
It should not be treated as a universal test for every possible quality concern.
HOW TO READ AN HPLC PURITY RESULT ON A COA
A PRACTICAL CHECKLIST
When reviewing a peptide Certificate of Analysis, examine the following:
Sample identification: Does the sample name match the compound?
Lot or batch: Can the report be connected to the relevant material?
Laboratory: Who performed the analysis?
Report date: When was testing reported?
Analytical method: Was HPLC or another chromatographic technique used?
Purity result: What percentage was reported?
Chromatogram: Is supporting chromatographic information available?
Identity testing: Was the expected peptide independently characterized?
Peptide content: Was the amount of peptide measured?
Limitations: What does the report say about its scope and applicability?
IMPORTANT
A report containing only a purity percentage may provide much less information than one containing multiple appropriately documented analytical measurements.
PURITY AND MULTI-PEPTIDE BLENDS
WHY BLENDS REQUIRE ADDITIONAL CARE
Some research formulations contain more than one peptide.
In those situations, analytical interpretation becomes more complex.
A laboratory may need to distinguish several intended active components while also evaluating related impurities.
For a multi-peptide blend, useful questions include:
Were all intended compounds identified?
Were the individual components quantified?
Was the intended formulation ratio evaluated?
Were relevant impurities adequately separated?
Does the reported purity refer to one component, multiple components, or a defined combined analytical calculation?
A SINGLE PERCENTAGE MAY NOT TELL THE WHOLE STORY
A reported blend purity of 99.4% does not, by itself, establish that every individual component is present in the intended amount.
For that, component-specific quantitative information is needed.
This is particularly relevant when interpreting the analytical documentation for research blends such as GLOW, KLOW, and BPC-157/TB-500 combinations.
COMMON MISINTERPRETATIONS
WHAT PEOPLE OFTEN GET WRONG
“99% PURE MEANS 99% OF THE VIAL IS PEPTIDE.”
Not necessarily.
Chromatographic area purity is not automatically equivalent to percentage by mass.
“THE BIGGEST PEAK PROVES THE PEPTIDE'S IDENTITY.”
No.
Peak size and retention time alone may be insufficient to establish molecular identity.
“99.9% IS ALWAYS BETTER THAN 99.0%.”
Not necessarily.
The analytical methods, uncertainty, impurity identities, and other quality attributes matter.
“HPLC TESTING PROVES THE VIAL IS STERILE.”
No.
Sterility requires appropriate microbiological testing.
“THE COA PROVES THE PRODUCT IS SAFE.”
No.
Analytical results do not replace clinical safety research.
“ONE TESTED VIAL MEANS EVERY VIAL WAS TESTED.”
No.
Results apply to the submitted sample, and conclusions about a broader lot require appropriate sampling and quality controls.
HOW CROIX PRESENTS PURITY DATA
ANALYTICAL TRANSPARENCY
Throughout the Croix Research Library and Certificate of Analysis documentation, purity results should be presented according to the specific laboratory report.
Where available, Croix identifies:
Compound or blend
Nominal strength
Lot or batch
Sample ID
Testing laboratory
Report date
Reported purity
Identity testing
Peptide content
Other reported analytical tests
OUR INTERPRETATION STANDARD
Croix does not treat a high HPLC purity percentage as proof of clinical safety, effectiveness, or regulatory approval.
Nor should a COA for one sample be represented as verification of unrelated lots or products.
The objective is to make analytical information understandable without extending its meaning beyond the underlying test.
THE SIMPLE VERSION
FIVE THINGS TO REMEMBER
1. HPLC separates components.
It helps researchers evaluate the chromatographic profile of a sample.
2. Purity is a relative measurement.
A reported percentage depends on the analytical method and calculation.
3. Purity and peptide content are different.
A high purity percentage does not establish the amount of peptide per vial.
4. HPLC does not test everything.
Identity, sterility, endotoxin, and other quality attributes may require additional methods.
5. Purity does not establish safety.
RESEARCH REFERENCES
AUTHORITATIVE RESOURCES
U.S. Food & Drug Administration
ICH Q2(R2): Validation of Analytical Procedures
FDA guidance describing the principles used to evaluate analytical procedures, including specificity, accuracy, precision, and quantitative performance.
U.S. Food & Drug Administration
ICH Q14: Analytical Procedure Development
Guidance addressing scientific approaches to analytical procedure development and ensuring methods are suitable for their intended purpose.
International Council for Harmonisation
ICH Quality Guidelines
Internationally harmonized scientific guidance addressing pharmaceutical quality and analytical testing.
U.S. Food & Drug Administration
ICH Q6A: Specifications, Test Procedures and Acceptance Criteria
Guidance distinguishing identification, assay, impurities, and other quality specifications.
ANALYTICAL NOTE
Chromatographic purity calculations depend on the specific method, detector response, peak integration, sample preparation, and laboratory reporting conventions.
The interpretation of a purity percentage should therefore remain tied to the analytical procedure used to generate it.
RESEARCH & EDUCATIONAL INFORMATION
This article is provided for research and educational reference and does not constitute individualized medical advice.
High Performance Liquid Chromatography is an important analytical technique for evaluating peptide purity and related substances. However, chromatographic purity represents only one aspect of analytical characterization.
A high purity percentage does not independently establish correct identity, labeled peptide content, sterility, endotoxin status, clinical safety, medical suitability, or FDA approval.
Throughout the Croix Research Library, purity results are interpreted in the context of the specific sample, analytical method, laboratory documentation, and limitations of the reported testing.
Purity is one piece of the analytical picture. Understanding the entire picture is what makes the data meaningful.
Continue Learning: explore more articles
RESEARCH FOUNDATIONS
Human vs. Preclinical Research
Why results from cells, animals and humans answer different questions.
Understanding Clinical Trial Phases
What Phase 1, Phase 2 and Phase 3 studies are designed to investigate.
FDA Approved vs. Off Label vs. Investigational
Terms that are frequently confused in discussions of peptide research.
LABORATORY & QUALITY
How to Read a Certificate of Analysis
HPLC and Peptide Purity Explained
Identity, Sterility & Endotoxin Testing Explained